Amazon Prime Day is one of Amazon’s biggest sales, and consumers were equally excited about the Prime Day sale this year.
The latest insights about the sale are finally out, and Amazon stated that this was the most prominent Prime Day event ever.
Here are some key takeaways from Amazon Prime Day 2024
- Prime Day sales in the United States reached $14.2 billion in 2024.
- 49.2% of the Prime Day event purchases were made through smartphones.
- BNPL orders accounted for 7.6% of the online purchases.
- 63% of Prime Day shoppers were highly satisfied with Prime Day deals.
Let’s take a detailed look at Amazon Prime Day sales worldwide, in the United States, and the latest facts and figures about Prime Day purchases, spending, and consumer behavior.
Latest Amazon Prime Day Statistics 2025 — Key Takeaways
- Prime day sales crossed $14.2 billion in 2024, a surge of 10% last year.
- The average spend per order was $57.97 in 2024 during Prime Day sales.
- Discounts during Prime Day ranged between 11% and 23% in the US.
- In India Prime Day 2024 saw as many as 24% more Prime members shop during the sale event, compared to late year.
US Amazon Prime Day Sales Data — July
| US Amazon Prime Day Sales | $14.2 billion |
| Day 1 Sales | $7.2 billion |
| Day 2 Sales | $7 billion |
| Sales Through Mobiles | $7 billion |
| Average Order Size | $57.97 |
| Discount Range | 11% to 23% |
| BNPL Purchases | $1.08 billion |
| Top Items On Prime Day 2024 | Amazon Fire TV Sticks, Premier Protein Shakes, and Liquid IV Packets. |
| Share of Amazon Prime Users that shopped on Prime Day | 88% |
Amazon Prime Day Sales Statistics 2025
Amazon Prime Day 2024 drove record sales of $14.2 billion in the United States.
That is a YoY increase of 11.7% in the Amazon Prime Day sales in the Country.
Consumers spent $7.2 billion on Day 1 of the Prime Day event, an increase of 11.7% compared to the previous year.
Meanwhile, on Day 2 of the event, consumers spent $7 billion, a 10.4% year-over-year growth.
Further, smartphone sales accounted for 49.2% of the total sales. That means consumers spent $7 billion during Prime Day through smartphones, an 18.6% YoY increase.
Source: Adobe.
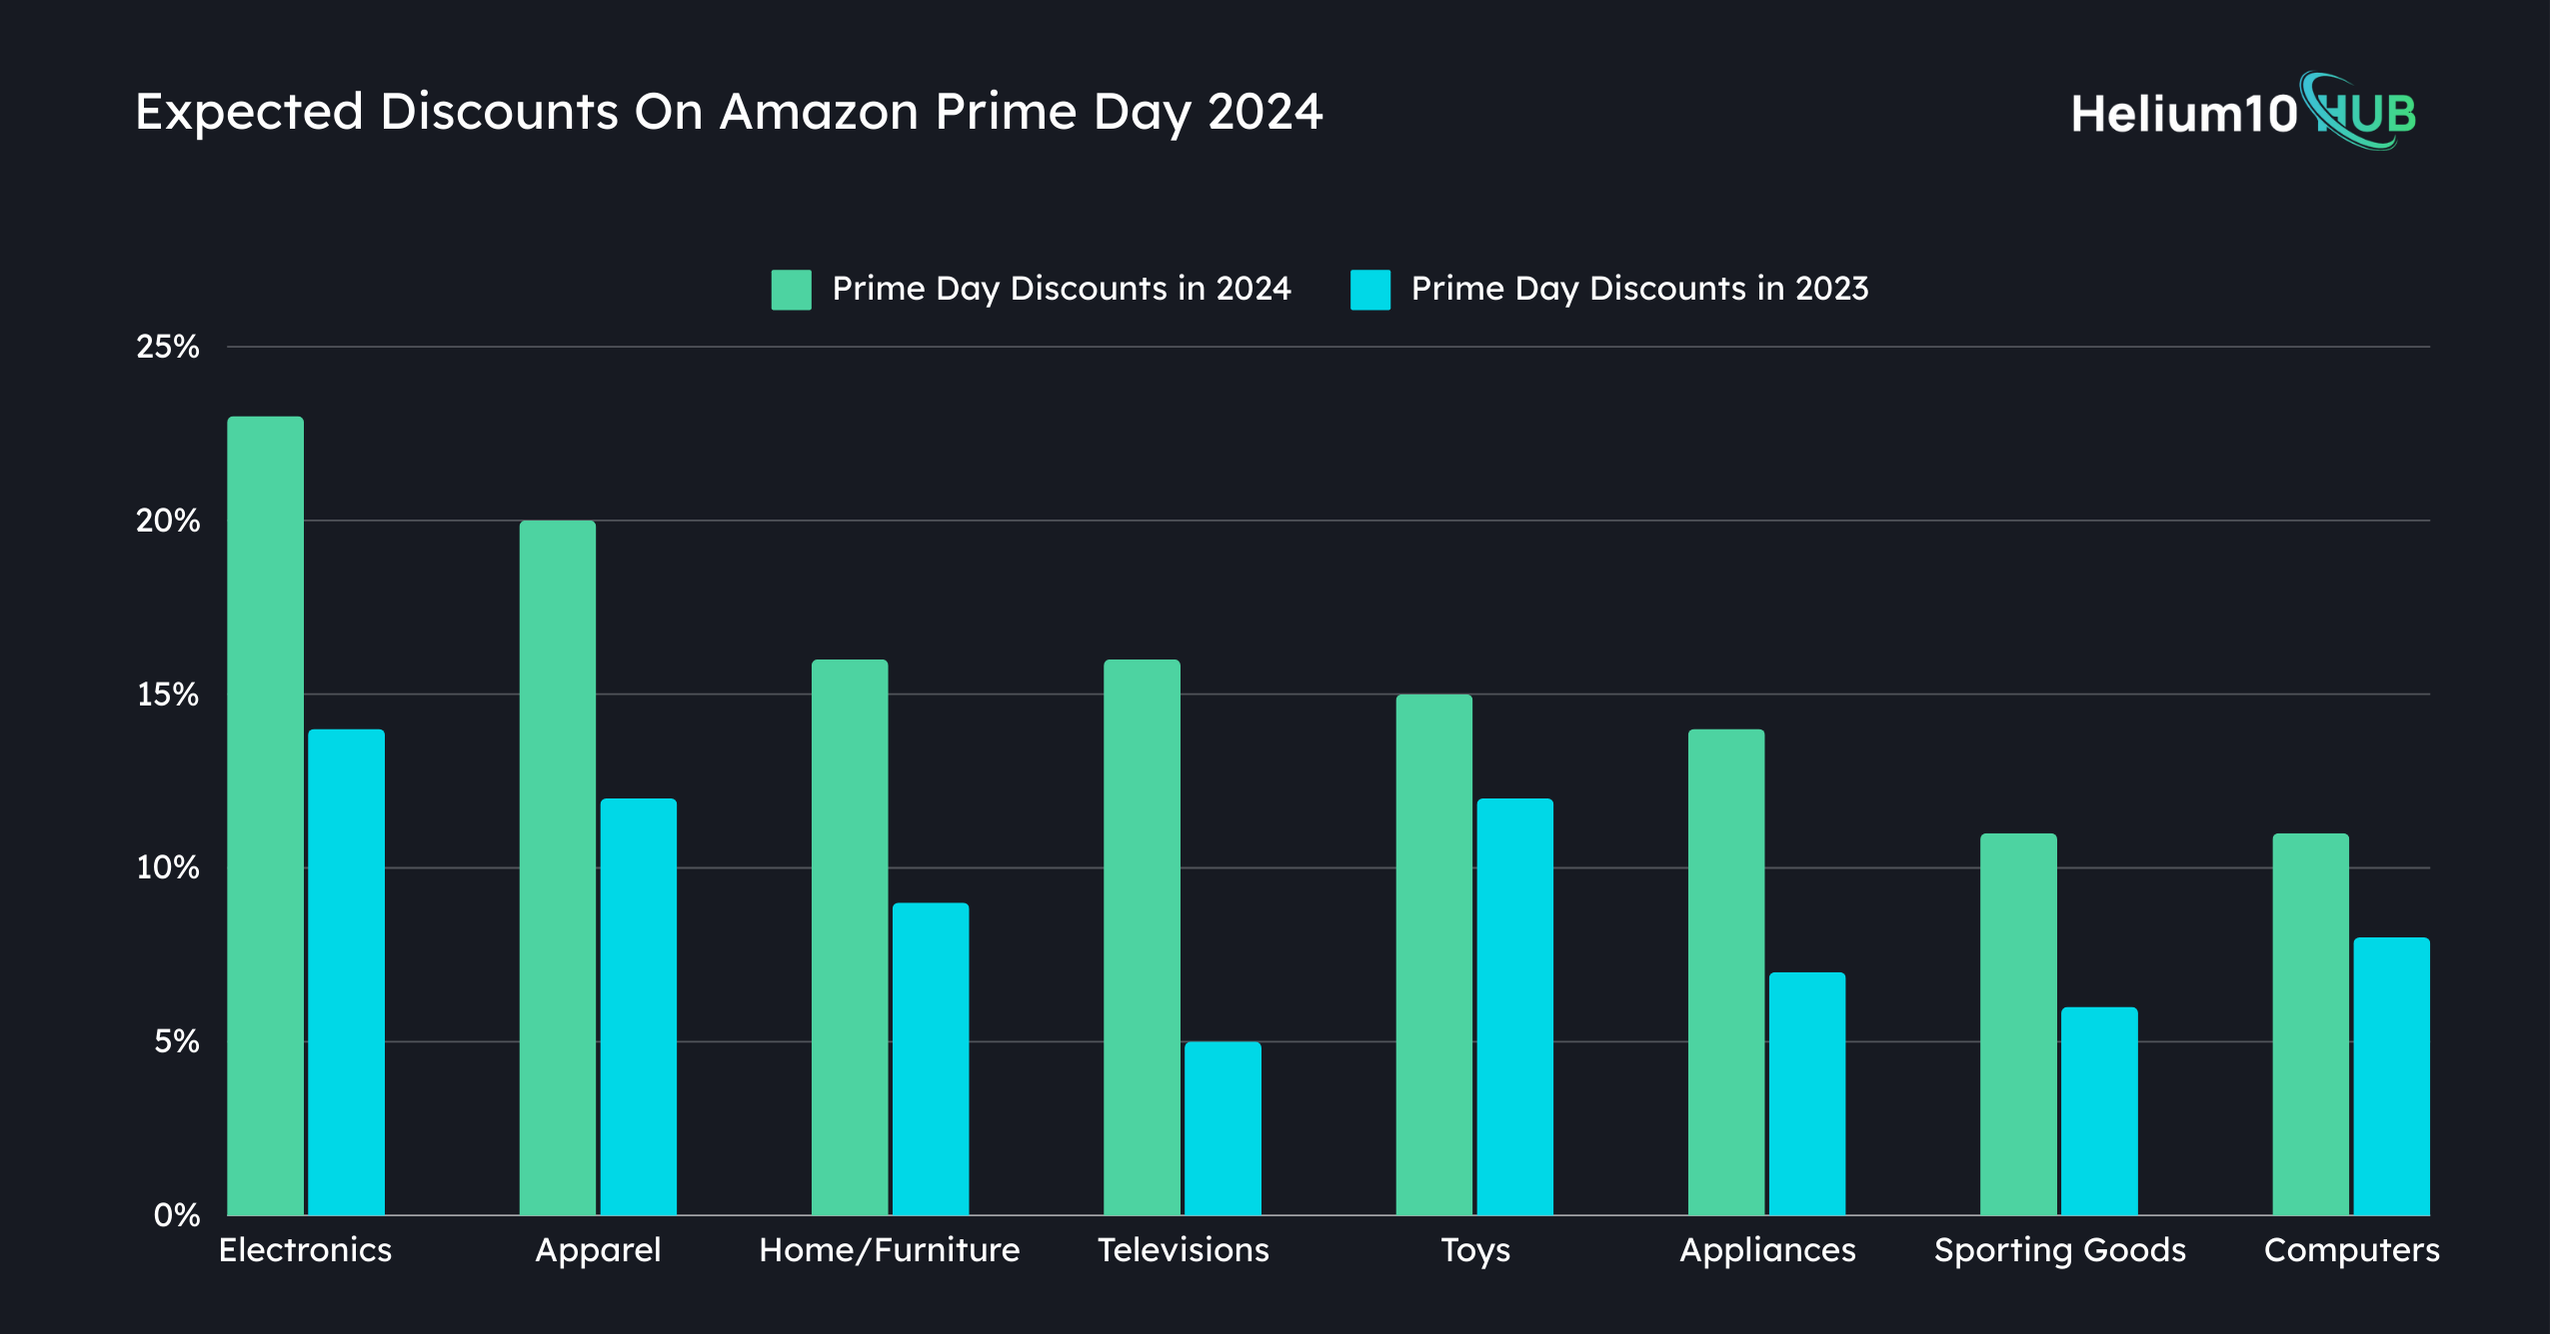
This year’s discount during the Prime Day sales ranged between 11% to 23%.
Electronics had the highest discounts, up to 23%, on the listed price. Comparatively, the discounts on electronics during the Prime Day sale in 2023 were up to 14%.
Plus, during the Prime Day event, apparel discounts were up to 20%, while computer discounts were up to 11%.
Home/furniture, Televisions, and toys are the other categories that had high discounts during Prime Day Sale 2024.

Here is a table displaying the discounts recorded on different categories in 2024 and 2023 during the Prime Day event.
| Category | Prime Day Discounts in 2024 | Prime Day Discounts in 2023 |
|---|---|---|
| Electronics | 23% | 14% |
| Apparel | 20% | 12% |
| Home/Furniture | 16% | 9 % |
| Televisions | 16% | 5% |
| Toys | 15% | 12% |
| Appliances | 14% | 7% |
| Sporting Goods | 11% | 6 % |
| Computers | 11% | 8% |
Source: Adobe
7.6% of the online orders during the 2-day Amazon Prime Day event were made with BNPL.
BNPL orders accounted for $1.08 billion of online sales. That’s a 16.4% YoY increase in the BNPL sales.
Source: Adobe
Global Amazon Prime Day sales
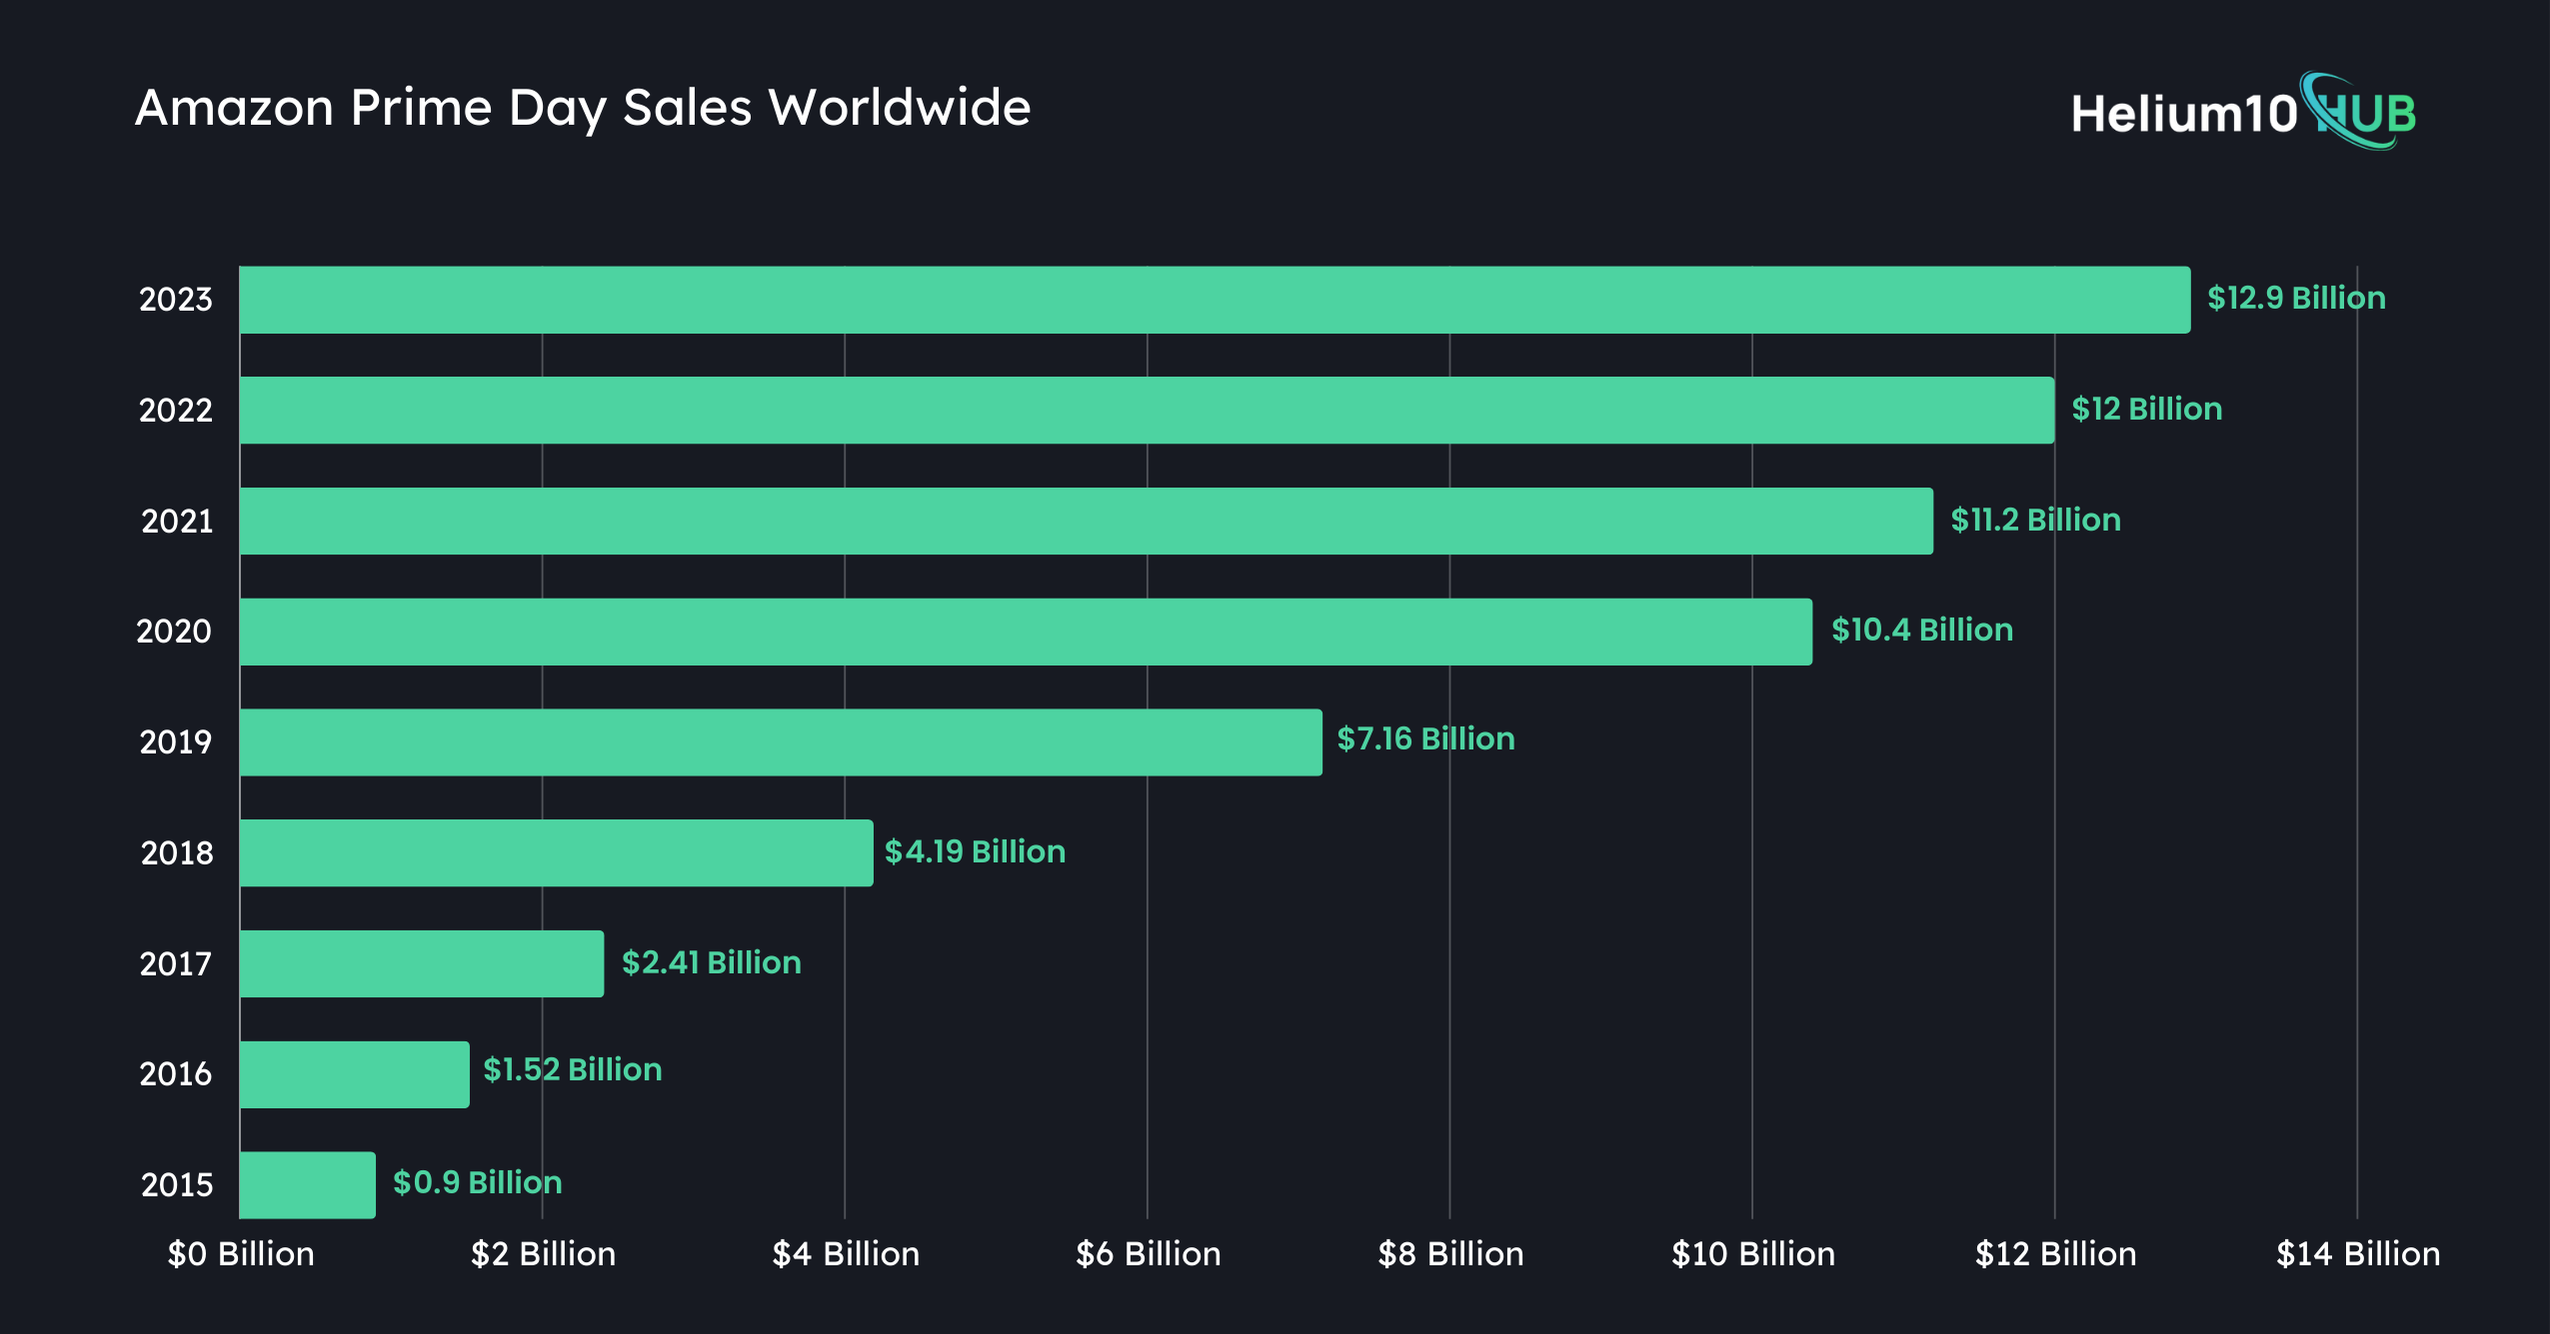
In 2023, Amazon Prime Day sales worldwide reached $12.9 billion.
That was an increase of 7.5% in the global sales recorded during Amazon Prime Day in 2023. In comparison $12 billion was recorded in sales on Amazon Prime Day in 2022.
Further, Amazon Prime Day sales worldwide jumped from $7.16 billion in 2019 to $10.4 billion in 2020, an increase of 45.25% compared to 2019. This shows that Amazon Prime Day sales spiked rapidly during the COVID-19 pandemic.

Here is a table displaying the Amazon Prime Day sales recorded worldwide over the years.
| Year | Amazon Prime Day Sales Worldwide |
|---|---|
| 2023 | $12.9 billion |
| 2022 | $12 billion |
| 2021 | $11.2 billion |
| 2020 | $10.4 billion |
| 2019 | $7.16 billion |
| 2018 | $4.19 billion |
| 2017 | $2.41 billion |
| 2016 | $1.52 billion |
| 2015 | $0.9 billion |
Source: Statista.
US Amazon Prime Day Sales
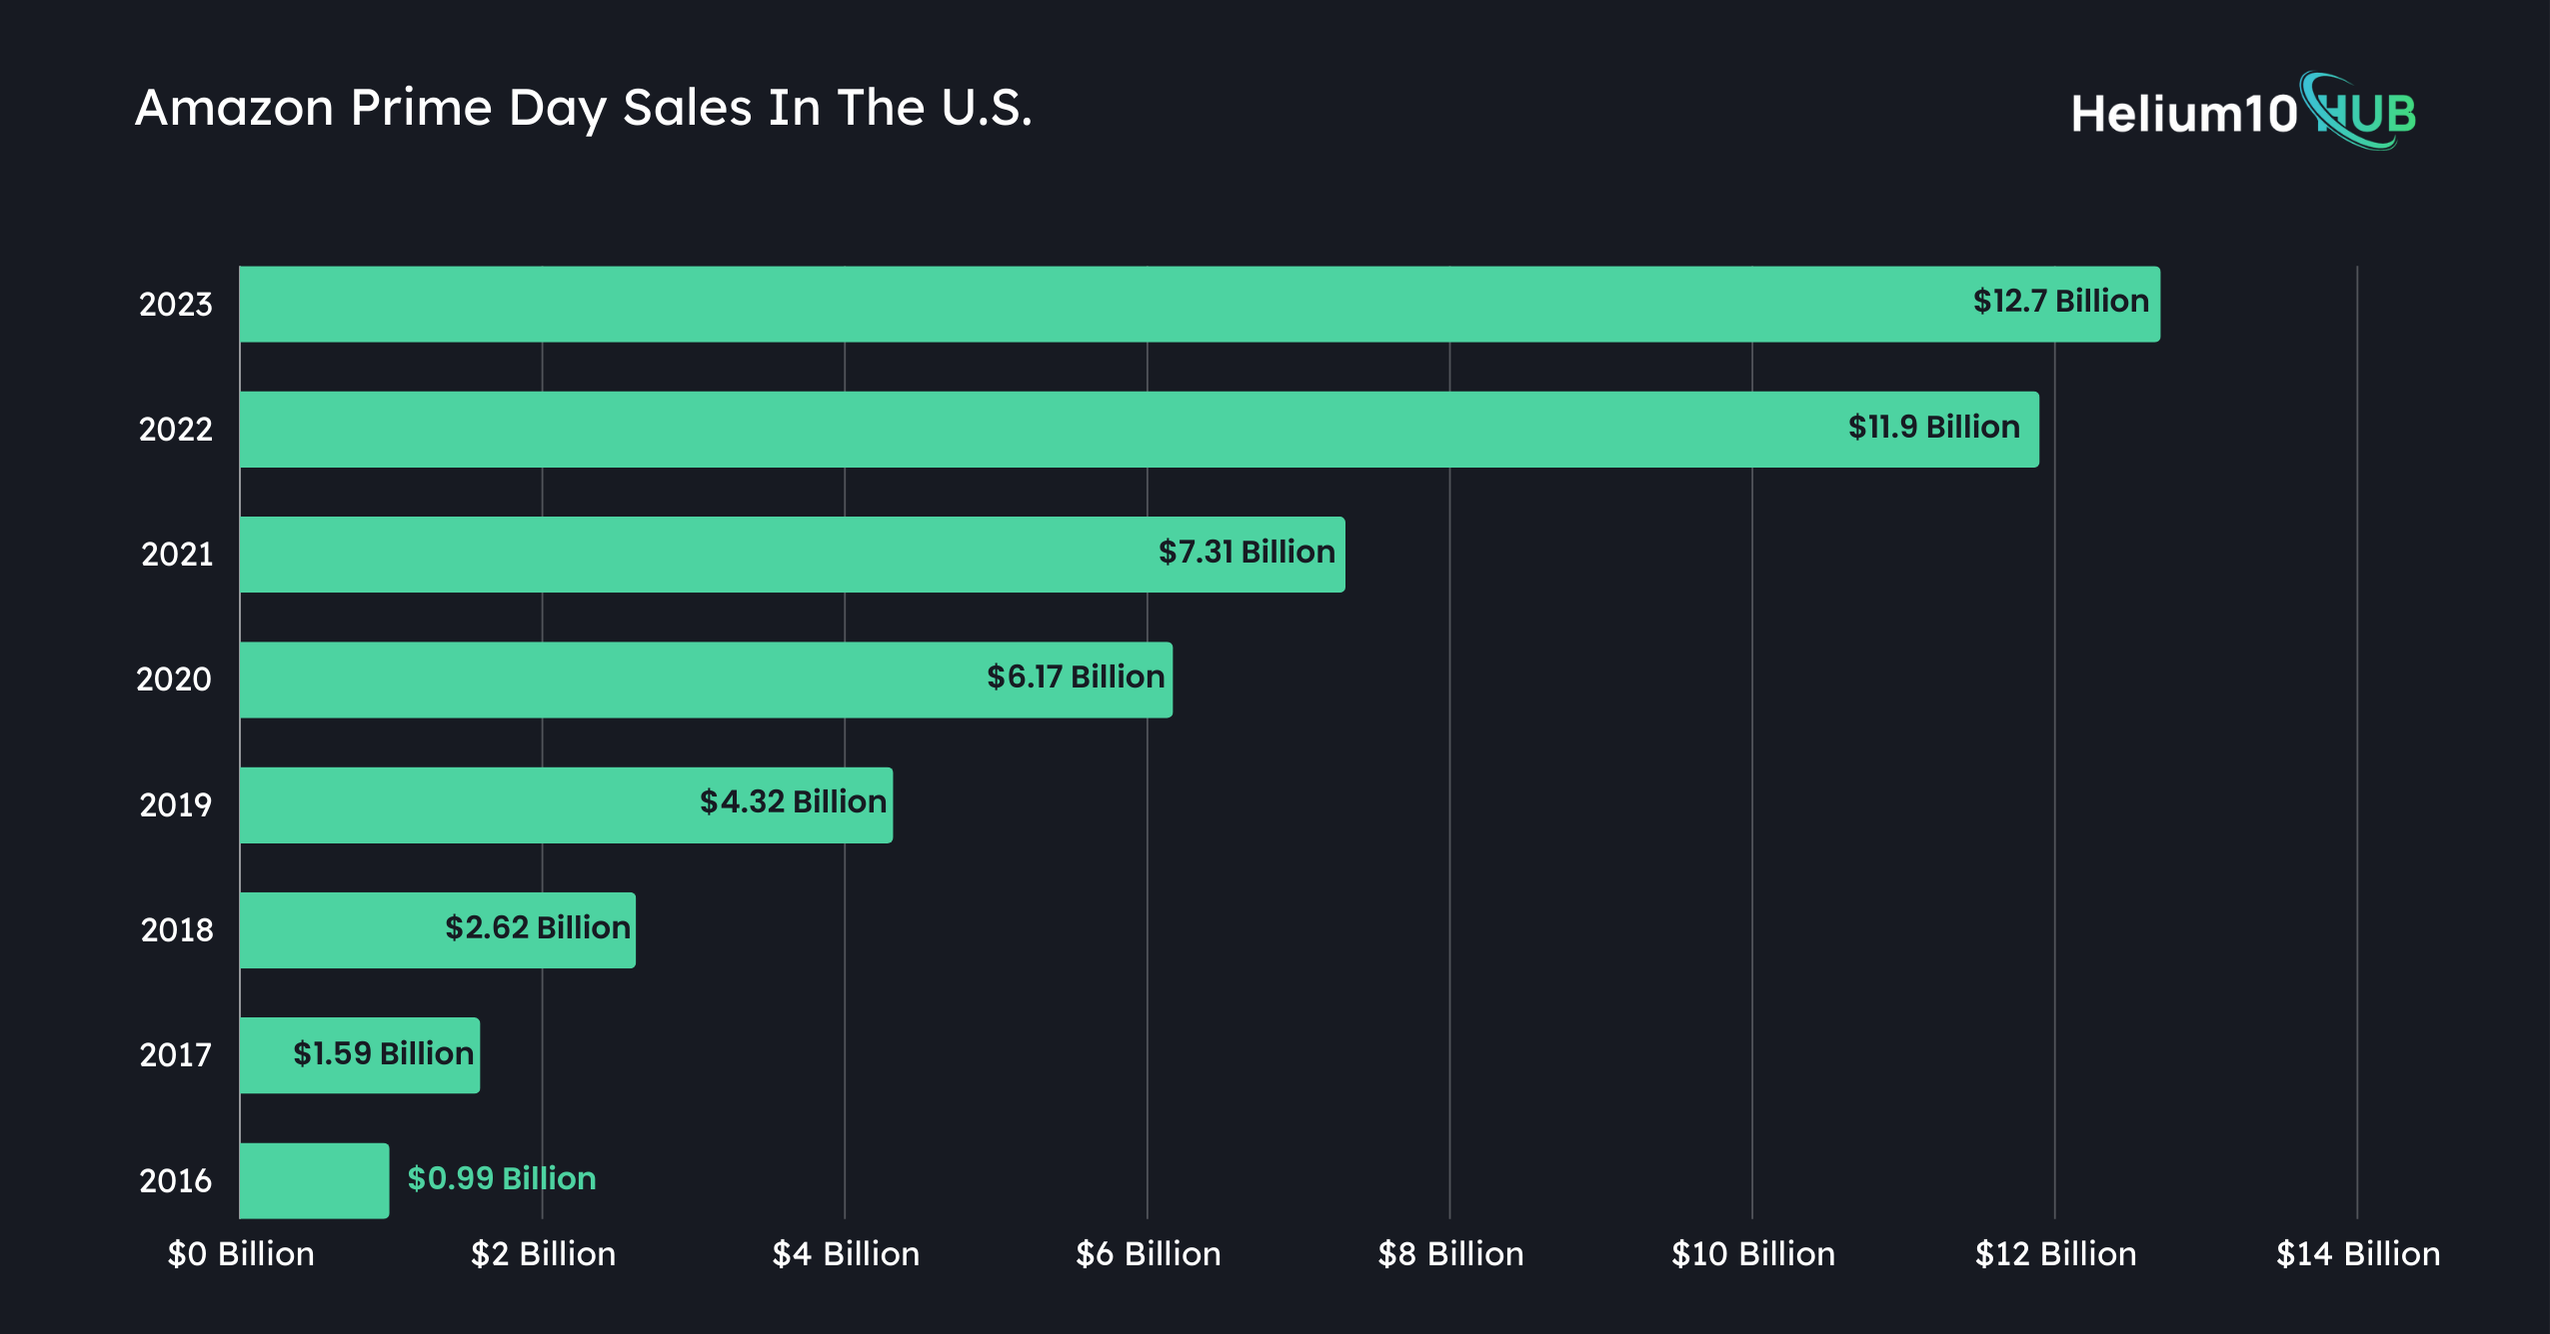
In 2023, the Amazon Prime Day Sales in the United States was $12.7 billion.
In comparison, Amazon Prime Day sales were $11.9 billion in 2022, an increase of 6.7% compared to the previous year.
The Amazon Prime Day sales in the United States jumped by 62.79% in 2022 compared to the sales of $7.31 billion recorded in 2021.

The following table displays the Amazon Prime Day Sales recorded in the United States over the years.
| Year | Amazon Prime Day Sales In The U.S. |
|---|---|
| 2023 | $12.7 billion |
| 2022 | $11.9 billion |
| 2021 | $7.31 billion |
| 2020 | $6.17 billion |
| 2019 | $4.32 billion |
| 2018 | $2.62 billion |
| 2017 | $1.59 billion |
| 2016 | $0.99 billion |
Source: Statista.
Over one-third of the households in the United States shopped on Amazon Prime Day in the United States in 2023.
On average, the orders per household in the United States during the Prime Day sales were recorded to be 3.1, while the average spendings per household were recorded to be $181.72.
Besides, the average order size per household was 1.9 items, and the spending per unit was recorded to be $31.21.
The following table displays the Prime Day stats recorded per household in the United States.
| Stats | Prime Day 2023 | Prime Day 2022 |
|---|---|---|
| Household penetration | 37.3% | 34.1% |
| orders per household | 3.1 | 2.9 |
| spendings per household | $181.72 | $176.71 |
| order size per household($) | $58.67 | $60.73 |
| order size per household | 1.9 | 1.6 |
| spending per unit | $31.21 | $32.71 |
Source: Numerator.
Over three-fourths of the households in the United States placed two or more orders during Prime Day in 2023.
Further, one-quarter of the households in the country placed over 5 orders from Amazon Prime in the United States, and just 15% of the households placed 3 orders.
Here is a table displaying the average number of orders placed by households during Amazon Prime Day in the United States in 2023.
| Orders Per Household | Percentage Of Households |
|---|---|
| 1 | 27% |
| 2 | 21% |
| 3 | 15% |
| 4 | 11% |
| 5+ | 25% |
Source: Numerator.
15% of the households in the United States spent up to $50 on average during Prime Day in 2023.
Further, just 1 in 10 households in the country spent over $500 during the Amazon Prime Day.
On the other hand, just 9% of households spent $100 on purchases during Amazon Prime Day.
The following table displays the average household expenditure recorded in the United States during the Prime Day sales in 2023.
| Average Household Spend | Percentage of Household |
|---|---|
| <$25 | 11% |
| <$50 | 14% |
| <$75 | 11% |
| <$100 | 9% |
| <$150 | 13% |
| <$200 | 9% |
| <$250 | 7% |
| <$300 | 5% |
| <$400 | 7% |
| <$500 | 5% |
| ≥$500 | 10% |
Source: Numerator.
Amazon Prime Day In The United Kingdom
Online shoppers in the United Kingdom spent 1.15 billion British pounds on Amazon Prime Day 2023.
On day one, sales of 581 million British pounds were recorded in the United States, while on day two of Amazon Prime sales, a total sales of 573 million pounds were recorded.
Comparatively, online shoppers in the country spent 1.12 billion British pounds on Amazon Prime Day in 2022.
The following table displays the sales on Amazon Prime Day recorded in the United Kingdom in 2022 and 2023.
| Year | Day One | Day Two |
|---|---|---|
| 2023 | 581 | 570 |
| 2022 | 573 | 550 |
Source: Statista.
Which Countries Get To Shop In Prime Day Deals?
24 countries worldwide participate in Amazon Prime Day deals.
However, the majority of the sales are recorded from the United States as the country is the biggest market for Amazon.
Here is a list of countries that participate in the Amazon Prime Day Deals:
- Australia
- Austria
- Belgium
- Brazil
- Canada
- Egypt
- France
- Germany
- India
- Italy
- Japan
- Luxembourg
- Mexico
- Netherlands
- Poland
- Portugal
- Saudi Arabia
- Singapore
- Spain
- Sweden
- Turkey
- The United Arab Emirates
- The United States
- The United Kingdom
Source: CNET.
Amazon Prime Day Purchases
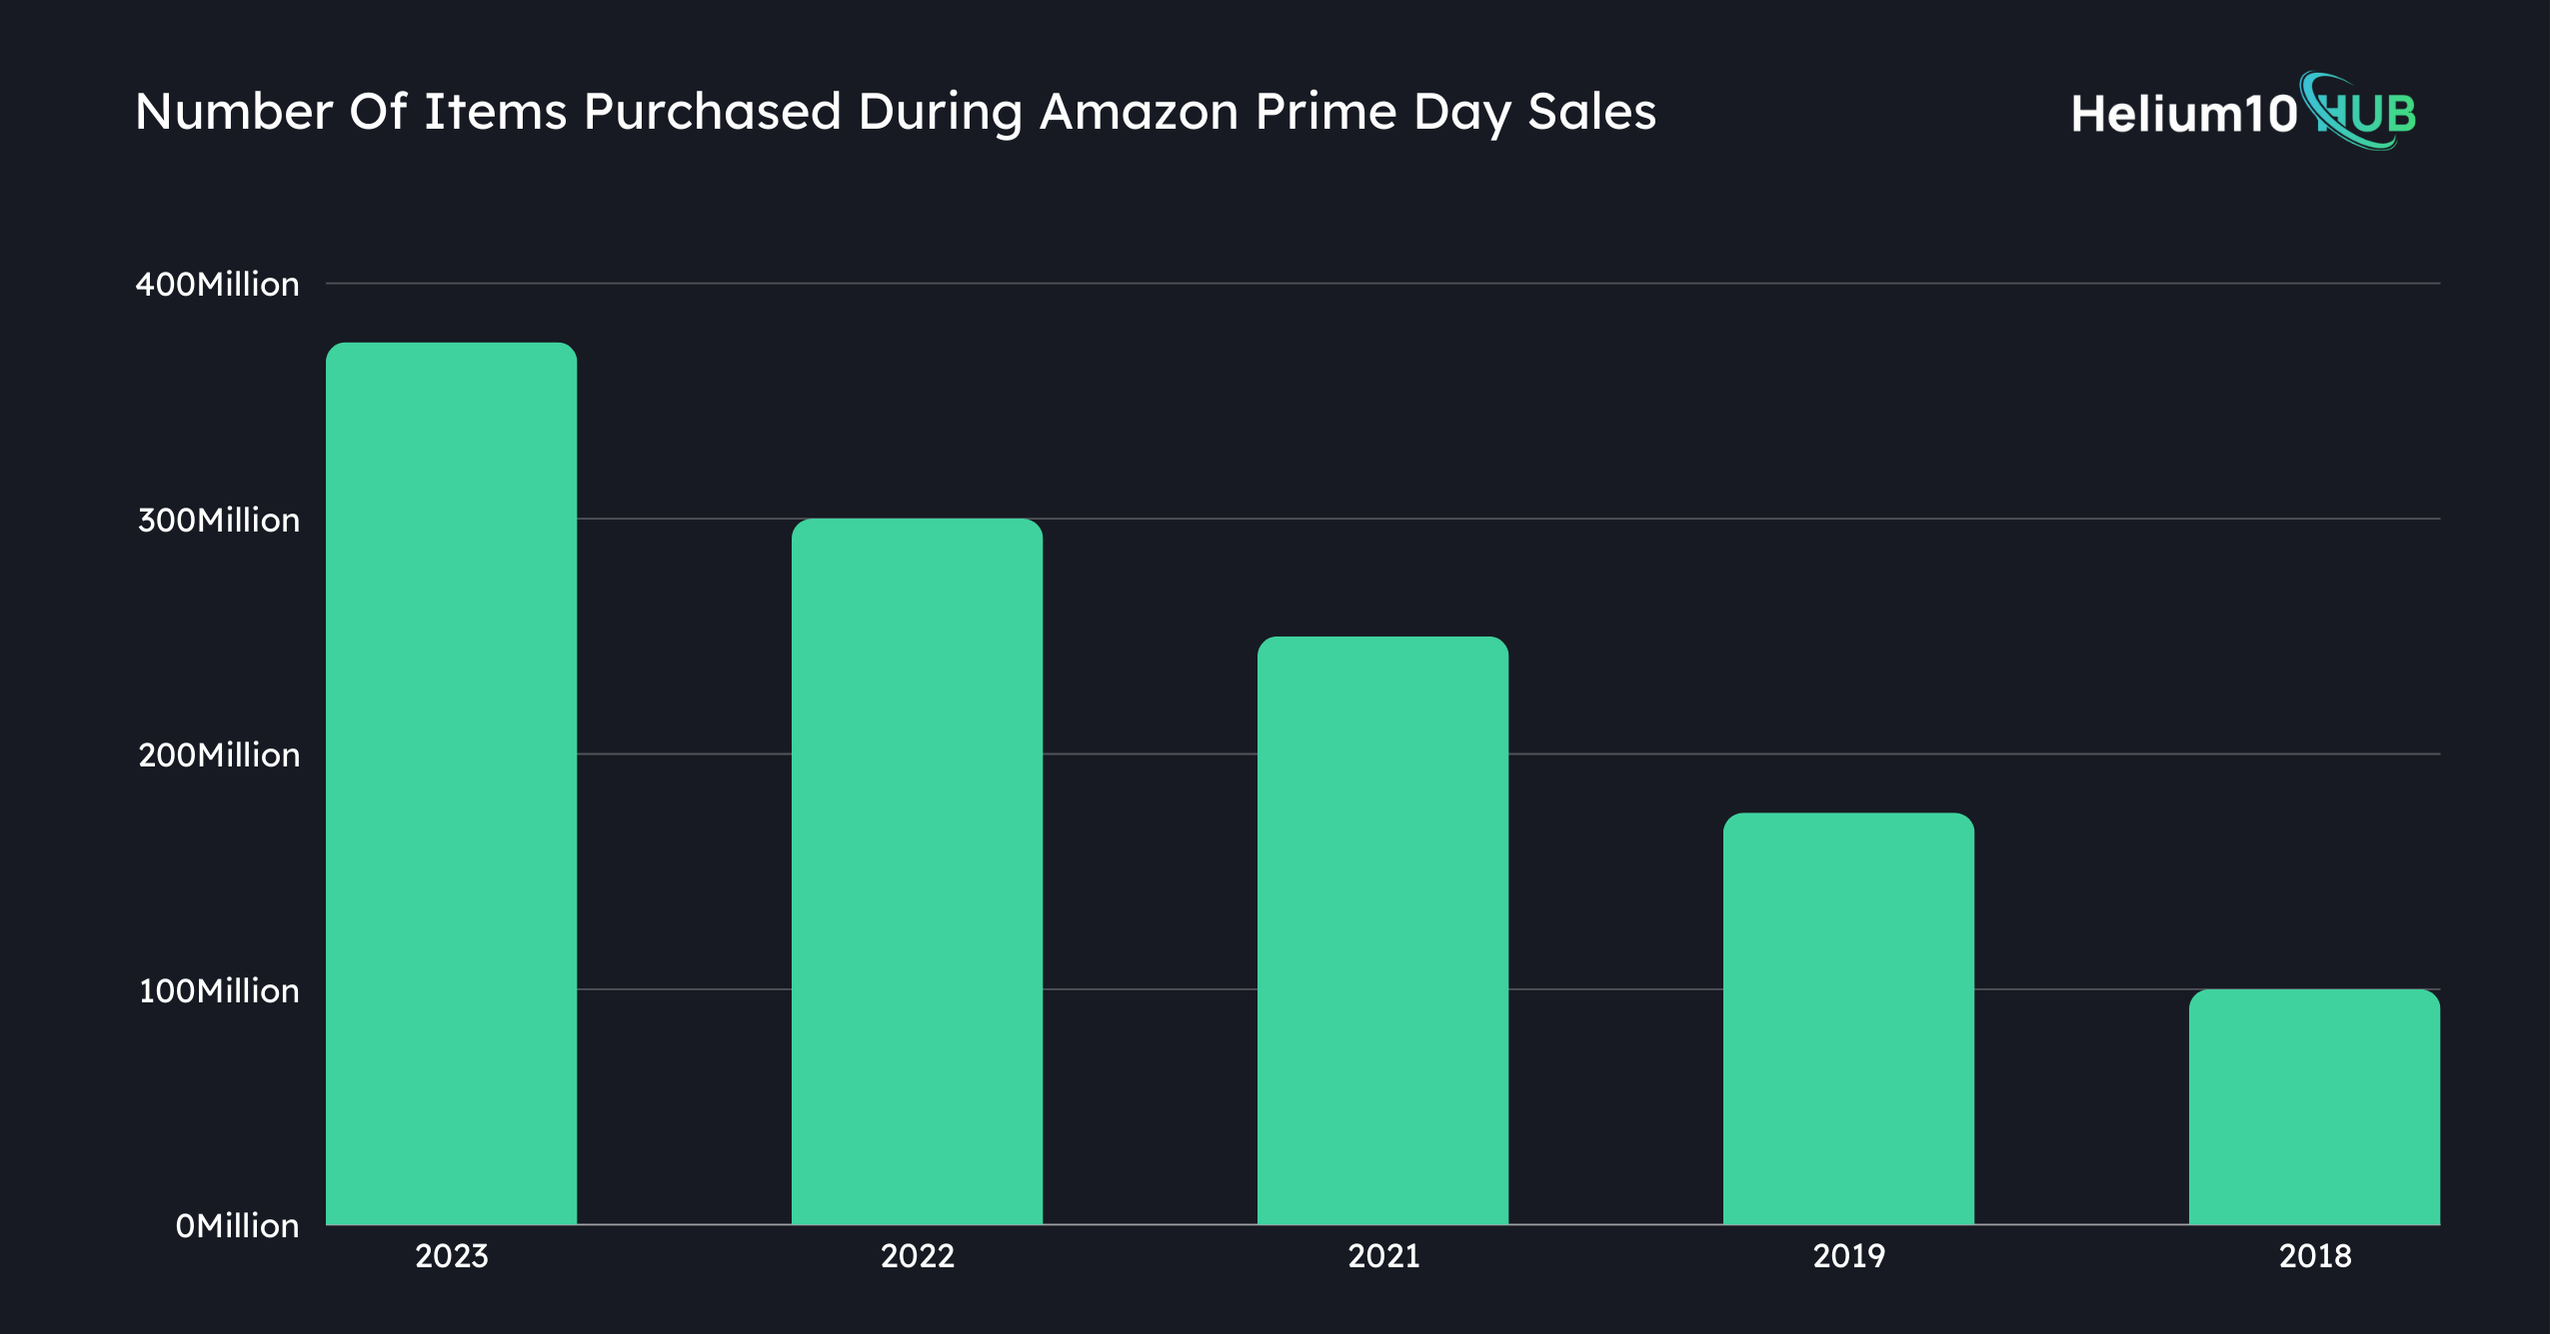
Consumers purchased 375 million items during the Amazon Prime Day sale in 2023.
That was an increase of 75 million purchased items in 2023 compared to 300 million items purchased in 2022.
Comparatively, only 100 million items were purchased by consumers on Amazon Prime Day sales in 2018. This shows the purchased items during Amazon Prime sales increased by 275 million since 2018.

The following table displays the number of items purchased by shoppers during Amazon Prime Sales over the years.
| Year | Number Of Items Purchased During Amazon Prime Day Sales |
|---|---|
| 2023 | 375 million |
| 2022 | 300 million |
| 2021 | 250 million |
| 2019 | 175 million |
| 2018 | 100 million |
Source: Statista.
Nearly 3 in 10 Amaozn Prime Day shoppers purchased home goods during the Amazon Prime Day sales in the United States.
The majority of the shoppers in the country purchased home decor during Amazon Prime Day sales in 2023, while just 125 purchased smart home devices.
Further, 26% of the shoppers purchased household essentials during Amazon Prime Day sales in 2023.
The following table displays the most popular product categories during the Amazon Prime Day sales in the United States in 2023.
| Product Categories | Percentage Of Amazon Prime Day Shoppers |
|---|---|
| Home goods | 28% |
| Household essentials | 26% |
| Apparel & shoes | 24% |
| Consumer electronics | 21% |
| Beauty and cosmetics | 19% |
| Health and wellness | 19% |
| Toys & video games | 15% |
| Pet care | 14% |
| Small appliances | 12% |
| Smart home devices | 12% |
Source: Statista.
9 out of 10 products with the highest sales growth during the Prime Day sales in 2023 belonged to the toys and homeware category in the United States.
The kitchen bowl by the brand Qiopertar gained an outstanding sales growth of 13,008,766% on Amazon Prime Day sales. It outranked the other products and was the product with the highest sales growth.
The following table displays the products with the highest sales growth during Amazon Prime Day in 2023 in the United States.
| Product Name | Category | Percentage Change In Sales |
|---|---|---|
| Qiopertar 1PC Rust Steel Light Luxury Thickened Multi-Functional Large Basin | Home and Kitchen | 13,008,766% |
| ZZKHGo Cordless Car Vacuum | Home and Kitchen | 4,646,359% |
| Play-Doh Slime 30 Can Pack | Toys and games | 1,234,700% |
| ZMLM 10 Inch LCD Writing Drawing Tablet – blue | Toys and games | 1,174,400% |
| ZMLM 10 Inch LCD Writing Drawing Tablet – pink | Toys and games | 782,900% |
| Squishmallows Original 12-inch Emery Pink Latte | Toys and games | 591,850% |
| Dash Precision Quick-Read Meat Thermometer | Home and Kitchen | 571,136% |
| iRobot Roomba j6+ (6550) Self-Emptying Robot Vacuum | Home and Kitchen | 549,914% |
| Squishmallows Original 12-inch Maisha Brown Beaver | Toys and games | 448,540% |
| JiaSifu 40×60 High Definition Monocular Telescope | Electronics | 417,043% |
Source: Statista
Amazon Prime Day Duration
The Amazon Prime Day Sales duration was initially 24 hours in 2015. The Prime Day sales were just for a day in 2015 and 2016. However, in 2017, the sales lasted for 30 hours, and in 2018, the Prime Day sales lasted for 36 hours.
Later in 2019, the Amazon Prime Day sales were extended for 2 days considering the response of consumers. Since then, Amazon Prime Day has lasted for 48 hours.
The following table displays the duration of the Prime Day sales recorded over the years.
| Sale-Year | Duration |
|---|---|
| July 16-17, 2024 | 48 hours |
| July 11-12, 2023 | 48 hours |
| July 12-13, 2022 | 48 hours |
| June 21-22, 2021 | 48 hours |
| October 13-14, 2020 | 48 hours |
| July 15-16, 2019 | 48 hours |
| July 16-17, 2018 | 36 hours |
| July 10-11, 2017 | 30 hours |
| July 12, 2016 | 24 hours |
| July 15, 2015 | 24 hours |
Source: Statista.
Amazon Prime Day Spending Statistics
In the United States, 23% of the orders placed during the Amazon Prime Day sales were worth up to $20.
Meanwhile, the lowest share of orders placed during the Prime Day sales were worth over $200.
Besides, 1 in 20 orders placed by the people in the United States was worth up to $40.
Here is a table displaying further details about the percentage of orders made during the Amazon Prime Day sales in the United States.
| Average Order Value | Share Or Orders |
|---|---|
| ≤ 10 | 17% |
| ≤ 20 | 23% |
| ≤ 30 | 15% |
| ≤ 40 | 10% |
| ≤ 50 | 6% |
| ≤ 100 | 15% |
| ≤ 200 | 9% |
| > 200 | 5% |
Source: Statista.
Consumer Behavior On Amazon Prime Day
Over in 9 in 10 Prime Day, shoppers stated that they had already made purchases during Prime Day sales in the past year.
Meanwhile, 85% of the shoppers in the United States stated that they would love it if Amazon hosted two Prime Day events in a year.
Besides, 6 in 10 Amazon Prime Day shoppers consider price an important factor while shopping.
Here is a table displaying further details about the opinions and shopping habits of Amazon Prime Day shoppers.
| Opinions And Shopping Habits | Percentage Of Shoppers |
|---|---|
| Have purchased during previous editions of Prime Day | 91% |
| Prefer to wait until Prime Day to bag a better deal, even if a product was on sale in the lead-up | 63% |
| Price is an extremely important factor | 61% |
| Will research products to purchase before Prime Day | 61% |
| Would love two Prime Day events a year | 85% |
Source: Statista
Over 1 in 2 shoppers in the United States shopped for the items they have been waiting to to purchase on sale.
At the same time, over one-third of the shoppers in the United States purchased items that were included in the lightning deals.
The following table provides further details about the types of purchases that US shoppers made during the Amazon Prime Day Sale in 2023.
| Types Of Purchases Made | Percentage Of Shoppers |
|---|---|
| Used the sale to stock up on sale items | 23% |
| Shopped for the same items they typically buy on Amazon | 32% |
| Same items I typically buy on Amazon | 32% |
| Items included in Lightning Deals | 34% |
| Items included in general Prime Day deals | 42% |
| Items I’ve been waiting to purchase on sale | 53% |
| Had an idea of what they wanted to purchase going into Prime Day | 82% |
Source: Numerator.
Over 7 in 10 US shoppers said they would purchase products on sale only if needed during the Amazon Prime Day sales.
At the same time, nearly one-third of Prime users in the United States considered recession fears to be one of the factors that influenced their shopping on Amazon Prime Day.
The following table displays the factors that influenced the purchases of people in the United States during Amazon Prime Day
| Relevant Factors Influencing Amazon Prime Day Shopping | Percentage Of US Shoppers |
|---|---|
| If there is a sale on items consumers need | 71% |
| Having a Prime membership | 53% |
| Shipping and delivery time | 43% |
| Recession fears | 32% |
Source: Statista.
Over 1 in 2 shoppers in the United States were discouraged from shopping on Amazon Prime Day due to product price inflation.
Meanwhile, one in four shoppers in the United States stated that rising interest rates were one of the major reasons they did not shop during Amazon Prime Day.
Here is a table displaying further factors that discouraged people in the United States from shopping on Amazon Prime Day in 2023.
| Factors Discouraging From Shopping | Percentage Of US Shoppers |
|---|---|
| Product price inflation | 54% |
| Rising interest rates | 25% |
| Spending more on travel and experiences | 18% |
| Making more of my purchases offline | 18% |
| Stock market valuations | 11% |
| None of the above | 24% |
Source: Statista
BNPL Purchases On Amazon Prime Day
927 million people in the United States made use of the BNPL option during the Prime Day sales in 2023.
Of these 461 people used BNPL for shopping on the first day of the sale, while 466 million people used the BNPL option for shopping on day 2 of the sale.
Comparatively, 739 people used the BNPL option while shopping on Amazon during the Prime Day sales in the United States in 2022.
The following table displays the number of people in the United States who used the BNPL option to shop during Amazon Prime Day sales.
| Day | 2023 | 2022 |
|---|---|---|
| Day one | 461 million | 371 million |
| Day two | 466 million | 368 million |
Source: Statista
More On Amazon Stats: